Analyzing your audience location with Twitter Streams and Heat Maps
2014/06/26 1 Comment
With the democratization of GPS and IP geolocation in portable devices (laptop, tablet, phone, Internet of things, …), more and more data containing geolocation information become available. Geolocation is now used by most of the main web applications to improve their services. For instance social network, transport network company or dating sites can use your instant location to show potential matches around you. Search engines can provide more personalized search result based on your location and ads network to better target their audience. With this geolocated data available in realtime, some applications such as Swarm, FourSquare are now allowing to be notified of friends coming nearby or events happening in their neighborhood.
In this post we will describe how to listen to tweet streams and represent their positions on a world map.
Introduction
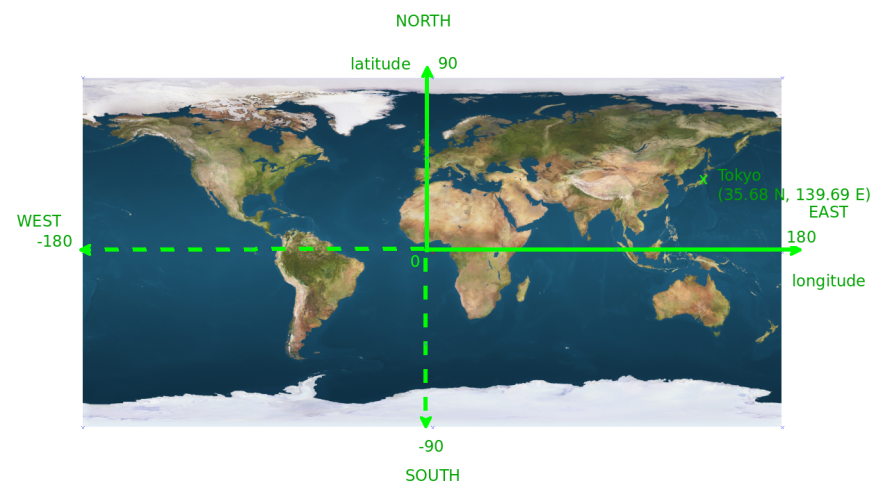
A geo location is described by three values:
- the latitude: the angular distance of the place to the earth’s equator (range from -90 to 90 degrees)
- the longitude: the angular distance of the place to the greenwish meridian (range from -180 to 180 degrees)
- the elevation: height above sea level

To represent the Earth’s surface on a two dimensional plane, we can use different map projections (Mercator, Tissot, …), each having their own advantages and drawbacks in term of distance, area and angle distortions.
We are going to use the equirectangular projection (also known as Platte Carrée) which is quite popular because of its simplicity. On a 2D map, the x-coordinate position is proportional to the longitude and the y-coordinate position to the latitude.

 In recent years, Apache Spark has gained in popularity as a faster alternative to Hadoop and it reached a major milestone last month by releasing the production ready version 1.0.0. It claims to be up to a 100 times faster by leveraging the distributed memory of the cluster and by not being tied to the multi stage execution of Map/Reduce. Like Hadoop, it offers a similar ecosystem with a database (Shark SQL), a machine learning library (MLlib), a graph library (GraphX) and many other tools built on top of Spark. Finally Spark integrates well with Scala and one can manipulate distributed collections just like regular Scala collections and Spark will take care of distributing the processing to the different workers.
 Frederic Dang Ngoc
 @fredang
Recent Comments